I will share my experiences and methodology about examining, analyzing and testing (if it possible) the antenna papers / articles. I am referencing and analyzing the dipole antenna with integrated balun design of Votis et al. [2]. Thanks for their precious work.
I am ordinarily encountered incorrect information regarding the antenna dimensions in papers which about antennas. When you design the given antenna with the given dimensions, it is pretty usual to face with a different design. Therefore, I use alternative approaches to determine the dimensions of antenna. But the paper I’ve analyzed is pretty generous about giving the values. Meanwhile, my aim is not stealing or harvesting the paper, I just wanted to analyze the outcomes and improve myself.
1- Reverse Engineering
I’ve made my dimension analysis with Fiji distribution of ImageJ [3]. You can find the software from this link. I won’t go into the whole process, but I’ll give a brief summary. After importing the image of produced antenna, you can use the Analyze > Set Scale option to match the pixels with given dimensions. You can check the dimension measurements for all the given values to be sure about the precision of the scale-matching. After being sure about the scaling, now you can easily measure the dimensions wherever you want and compare with the given dimensions in the paper. You can create measurements records by pressing T key from the keyboard and after measuring the whole desired dimensions and distances, you can select all measurements from ROI Manager and click “Measure” button. It will display the measurement values and their labels into the “Results” window as shown below.
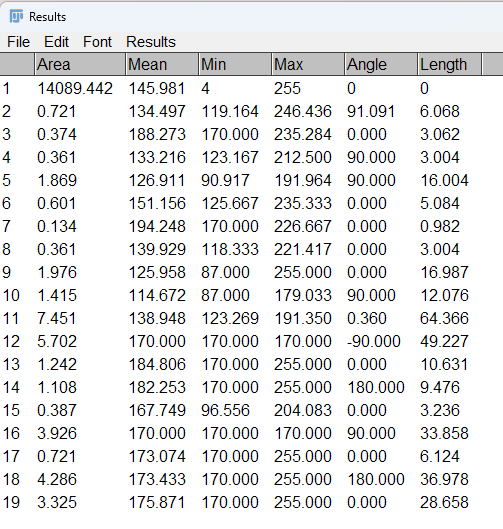
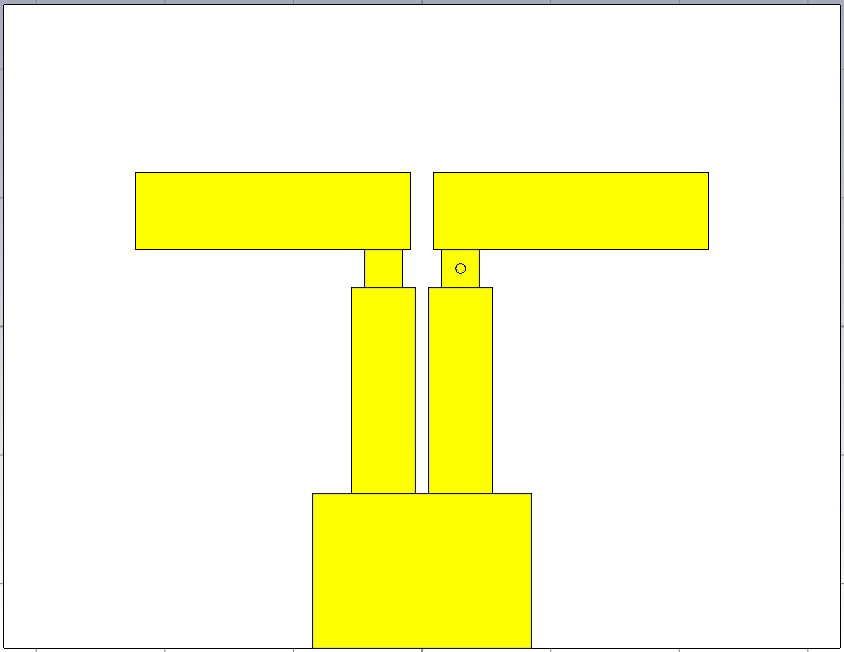
You can also activate displaying labels in Results window from Analyze > Set Measurements tab. It is pretty useful software solution. Here is the Figure 2: Printed Dipole Antenna image that I’ve got the measurements from the examined paper of Votis [2].
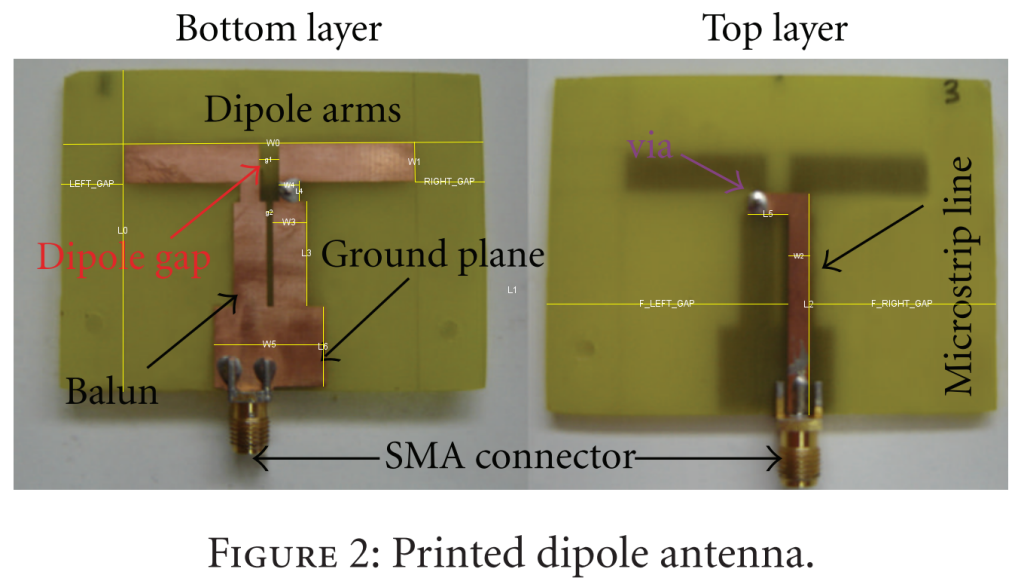
You can see my labels and measurements from the image with white texts over the yellow lines. You can see the final measurement table below:
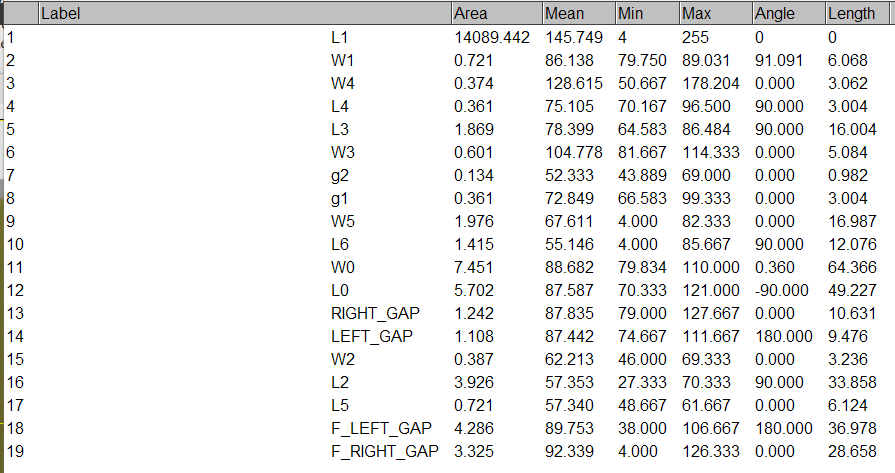
Also you can find those measurements from the given CSV file below.
Let’s compare the given values from the paper and measured values below:
| NAME | VAL_PAPER | VAL_MEAS | VAL_SIM |
| L1 | 20.8 | – | 20.8 |
| L2 | 32 | 33.858 | 31 |
| L3 | 16 | 16.004 | 16 |
| L4 | 3 | 3.004 | 3 |
| L5 | 3 | 6.124 | 6 |
| L6 | 12 | 12.076 | 12 |
| W1 | 6 | 6.068 | 6 |
| W2 | 3 | 3.236 | 3 |
| W3 | 5 | 5.084 | 5 |
| W4 | 3 | 3.062 | 3 |
| W5 | 17 | 16.987 | 17 |
| g1 | 3 | 3.004 | 3 |
| g2 | 1 | 0.982 | 1 |
| r | 0.375 | – | 0.375 |
| L0 (H0) | – | 49.227 | 50 |
| W0 | – | 64.366 | 65 |
| LEFT_GAP | – | 9.476 | |
| RIGHT_GAP | – | 10.631 | |
| F_LEFT_GAP | – | 36.978 | |
| F_RIGHT_GAP | – | 28.658 |
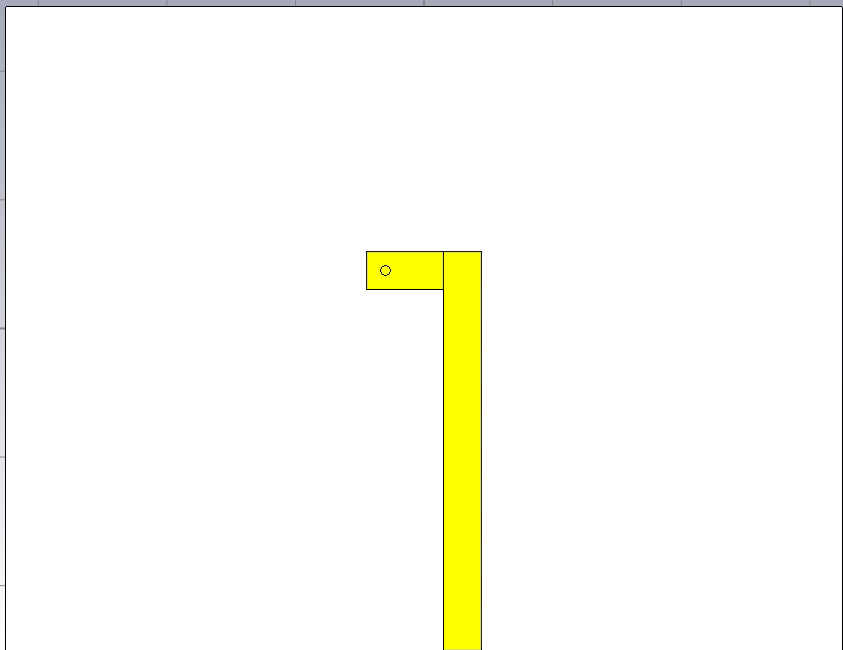
A problem happens every time that I want to measure the first. Therefore, the value of the L1 is null on the measurements. Also here are the
The next step will be drawing the antenna with the measured dimensions.
NOT COMPLETED YET
Bibliography
- Krouka, Wafa & Fenni, Sofia & Aksas, R.. (2015). Evaluation of Polarization Diversity Antenna for Wireless Communication Application. 10.1109/INTEE.2015.7416790.
- Votis, Constantinos I., Kostarakis, Panos, Alexandridis, Antonis A., Design, Analysis, and Measurements of an Antenna Structure for 2.4 GHz Wireless Applications, International Journal of Antennas and Propagation, 2010, 796154, 14 pages, 2010. https://doi.org/10.1155/2010/796154
- Fiji, ImageJ distribution. [Online]. Available: https://imagej.net/software/fiji/downloads. Accessed: Apr. 30, 2026.
Leave a Reply